Employer Satisfaction Survey
The ESS is the only national survey that measures how well graduates from Australian higher education institutions meet employer needs. It uses a unique methodology to link the experiences of graduates to the views of their direct supervisors. Data from the ESS are used to better understand the specific skills and attributes needed in business today, how well higher education is preparing graduates for the workforce and the varied employment pathways graduates are taking after completing their study.
 Target population
Over 3,400 supervisors of employed graduates
 Sample size
Employers of graduates of Australian higher education institutions
 Survey cycle
Conducted annually
2020 ESS Results
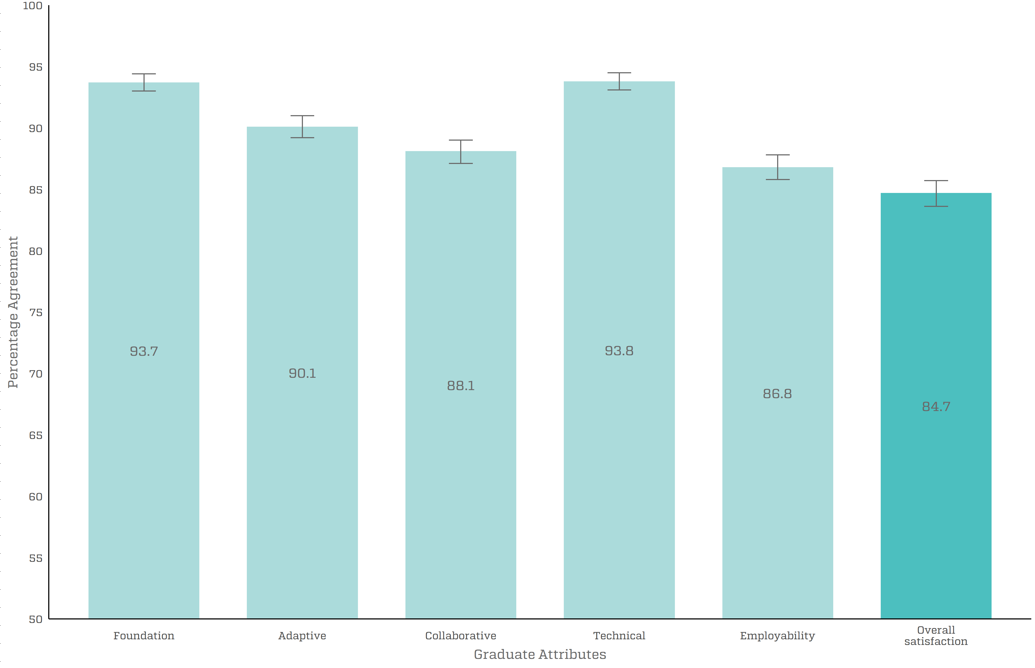
In 2020 the supervisor response rate was 45.5 per cent with over 3,400 supervisor responses. The 2020 ESS results are large enough to provide robust comparisons by broad field of education, course characteristics, employment characteristics, occupation and demographic group. There are sufficient results from the 2018, 2019 and 2020 ESS combined to provide comparisons across universities. With the overall satisfaction of graduates rated by direct supervisors at 84.7 per cent, the results of the 2020 ESS affirm the value of higher education qualifications for employment. Below is a summary of the survey outcomes. The 90 per cent confidence intervals are presented to aid in interpretation of the data. Please refer to the 2020 ESS National Report for detailed ESS results.
Employer satisfaction with graduate attributes and overall satisfaction (%, with 90 per cent confidence intervals)
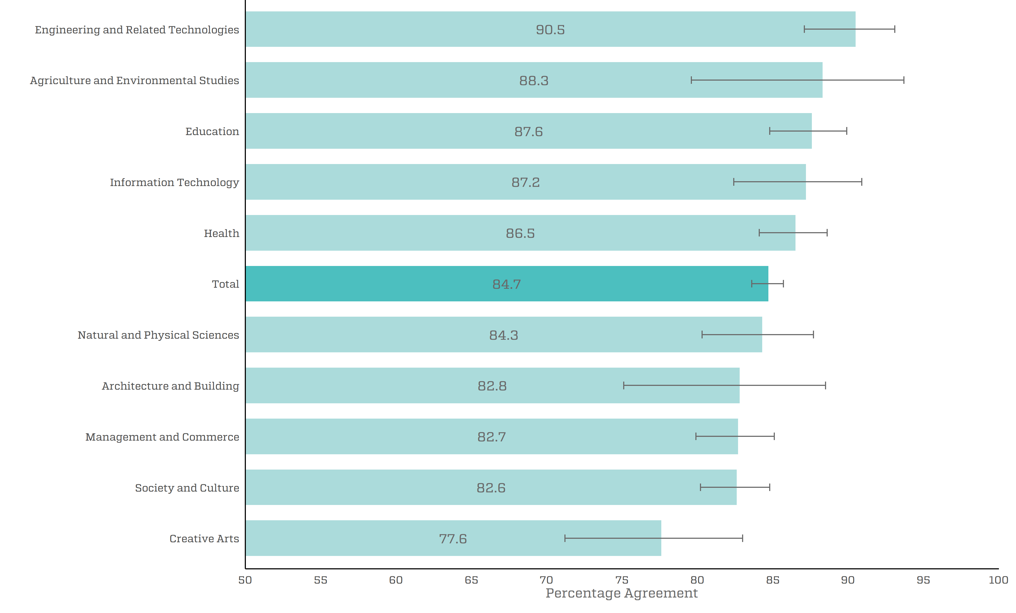
In 2020, employers reported highest overall satisfaction with Engineering and Related Technologies graduates at 90 per cent. Supervisors also reported above average satisfaction with Agriculture and Environmental Studies graduates, 88 per cent, Education graduates, 88 per cent, Information Technology graduates, 87 per cent, and Health graduates 86 per cent. On the other hand employer satisfaction, while still high, appears lower for Creative Arts graduates at 78 per cent, Society and Culture, Management and Commerce, and Architecture and Building graduates, all 83 per cent, and Natural and Physical Sciences graduates, 84 per cent.
Employer overall satisfaction by broad field of education, 2020 (%, with 90 per cent confidence intervals)
Employer satisfaction with graduate attributes and overall satisfaction, by broad field of education, 2020 (%, with 90 per cent confidence intervals)
| Foundation | Adaptive | Collaborative | Technical | Employability | Overall satisfaction | |
|---|---|---|---|---|---|---|
Natural and Physical Sciences | 91.4 (88.1, 93.9) | 88.9 (85.2, 91.8) | 88.5 (84.8, 91.4) | 93.7 (90.6, 95.8) | 86.1 (82.1, 89.3) | 84.3 (80.3, 87.7) |
Information Technology | 95.2 (91.6, 97.4) | 90.2 (85.6, 93.4) | 89.8 (85.3, 93.1) | 95.7 (92.1, 97.7) | 84.0 (78.6, 88.2) | 87.2 (82.4, 90.9) |
Engineering and Related Technologies | 95.1 (92.3, 96.9) | 87.9 (84.2, 90.9) | 90.5 (87.1, 93.1) | 92.9 (89.8, 95.2) | 87.4 (83.6, 90.5) | 90.5 (87.1, 93.1) |
Architecture and Building | 92.0 (85.6, 95.7) | 87.1 (79.8, 92.0) | 90.8 (84.3, 94.9) | 94.1 (88.2, 97.3) | 87.1 (79.8, 92.0) | 82.8 (75.1, 88.5) |
Agriculture and Environmental Studies | 98.3 (92.3, 100.0) | 95.0 (87.8, 98.3) | 91.8 (83.9, 96.2) | 98.3 (92.3, 100.0) | 85.0 (75.8, 91.2) | 88.3 (79.6, 93.7) |
Health | 94.6 (93.0, 95.9) | 90.3 (88.2, 92.1) | 89.2 (87.0, 91.1) | 94.6 (92.8, 95.9) | 85.3 (82.8, 87.5) | 86.5 (84.1, 88.6) |
Education | 93.4 (91.2, 95.1) | 91.6 (89.2, 93.5) | 86.1 (83.2, 88.5) | 94.5 (92.4, 96.0) | 86.0 (83.0, 88.5) | 87.6 (84.8, 89.9) |
Management and Commerce | 94.6 (92.8, 95.9) | 90.1 (87.8, 91.9) | 86.7 (84.2, 88.8) | 92.9 (91.0, 94.5) | 89.7 (87.4, 91.6) | 82.7 (79.9, 85.1) |
Society and Culture | 92.8 (91.1, 94.3) | 90.8 (88.9, 92.4) | 88.0 (85.8, 89.8) | 93.3 (91.6, 94.7) | 87.9 (85.7, 89.7) | 82.6 (80.2, 84.8) |
Creative Arts | 92.6 (87.9, 95.6) | 89.4 (84.1, 93.1) | 88.2 (82.9, 92.1) | 95.5 (91.4, 97.8) | 88.3 (82.7, 92.2) | 77.6 (71.2, 83.0) |
Total | 93.7 (93.0, 94.4) | 90.1 (89.2, 91.0) | 88.1 (87.1, 89.0) | 93.8 (93.1, 94.5) | 86.8 (85.8, 87.8) | 84.7 (83.6, 85.7) |
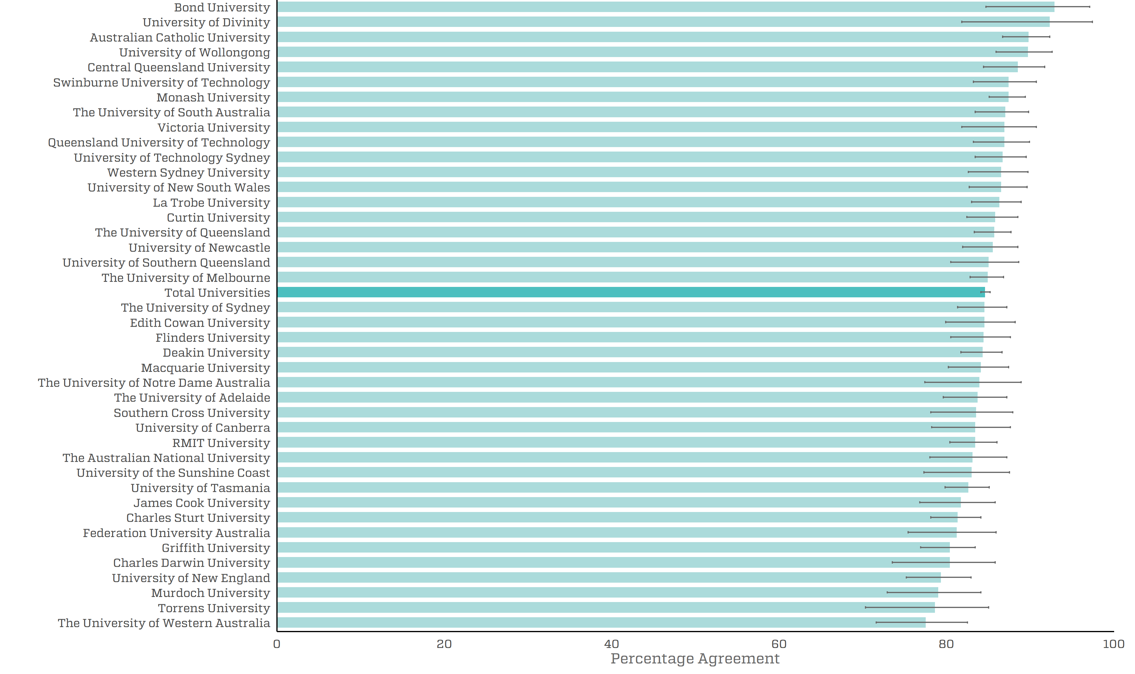
Employer satisfaction is consistently high across Australia’s Table A and B universities, with overall satisfaction ranging from 93 per cent to 78 per cent across universities, when results are combined from the 2018, 2019 and 2020 surveys. Employers rate graduates from Bond University highest at 93 per cent, followed by University of Divinity, 92 per cent, and Australian Catholic University and the University of Wollongong, both 90 per cent.
Note caution is warranted in interpreting differences in employer satisfaction across universities due to the relatively small number of survey responses at some universities.
Results for individual non-university higher education institutions (NUHEIs) are not published as the number of employer responses remains too small.
Employer overall satisfaction by institution, 2018 to 2020 (%)
Download the latest reports
About the ESS
The ESS provides information about the quality of education provided at Australian institutions, by asking supervisors to provide feedback about the generic skills, technical skills and work readiness of the graduate employed in their workplace. It is the first national survey that links the experiences of graduates to the views of their direct supervisors. The ESS is undertaken on a systematic basis by asking employed graduates who participated in the GOS to provide the contact details of their supervisor for follow up. The ESS has been conducted annually since 2016
While there are an insufficient number of responses to publish institution by study area results on the ComparED website, the ESS is large enough to provide comparisons by broad field of education, course characteristics, employment characteristics, occupation and demographic group.
Results are pooled across the three most recent collection years to enable comparisons across universities. This follows the approach for other surveys on the ComparED website where results are pooled across years to improve the robustness and validity of data. The QILT reports and ComparED website do not publish results where there are fewer than 25 survey responses. For this reason, results for individual non-university higher education institutions (NUHEIs) are not shown as the number of employer responses is generally too small.
- Overall satisfaction
- Foundation skills - general literacy, numeracy and communication skills and the ability to investigate and integrate knowledge
- Adaptive skills - the ability to adapt and apply skills/knowledge and work independently
- Collaborative skills - teamwork and interpersonal skills
- Technical skills - application of professional and technical knowledge and standards
- Employability skills - the ability to perform and innovate in the workplace
Overall satisfaction
The percentage of supervisors who expressed overall satisfaction with their graduate.
Foundation skills
The percentage of supervisors who expressed satisfaction with graduates’ foundation skills.
Adaptive skills
The percentage of supervisors who expressed satisfaction with graduates’ adaptive skills.
Collaborative skills
The percentage of supervisors who expressed satisfaction with graduates’ collaborative skills.
Technical skills
The percentage of supervisors who expressed satisfaction with graduates’ technical skills.
Employability skills
The percentage of supervisors who expressed satisfaction with graduates’ employability skills.